This work is part of my final degree work for Telecommunications Engineering. –> Complete PDF File
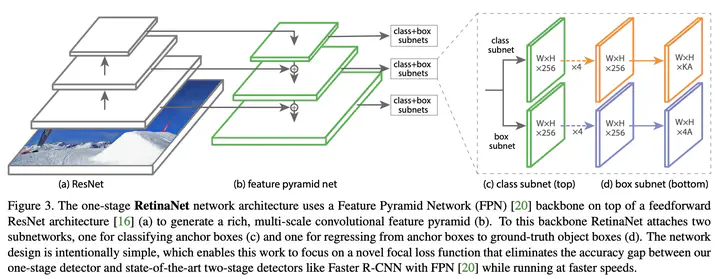
I’m going to train Keras-RetinaNET model to detect objets in handwritten music documents in the field of Optical Music Recognition.
I was using Google Colab connected to My Google Drive to store data. You can follow the installation, training, convert model and evaluation in: “RetinaNET Keras.ipynb”. In the annotation procces I used MATLAB Image Labeler and to convert to CSV files, python scripts.
Installation RetinaNET
I use the RetinaNET model implementated in keras. To install correctly RetinaNET-Keras, you have to follow the steps that they provide in their repository:
- Clone this repository. (https://github.com/fizyr/keras-retinanet)
- Ensure numpy is installed using
pip install numpy - In the repository, execute
pip install . --user - Run this command to compile Cython code:
python setup.py build_ext --inplace
Annotations
mat The CSV file with annotations should contain one annotation per line. Images with multiple bounding boxes should use one row per bounding box. Note that indexing for pixel values starts at 0. The expected format of each line is:
path/to/image.jpg,x1,y1,x2,y2,class_name
Some images may not contain any labeled objects.
To add these images to the dataset as negative examples,
add an annotation where x1, y1, x2, y2 and class_name are all empty:
path/to/image.jpg,,,,,
My annotations files: train_labels.csv / test_labels.csv
Class mapping format
The class name to ID mapping file should contain one mapping per line. Each line should use the following format:
staff,0
lyrics,1
emprty_staff,2
My class file: classes.csv
Anchor optimization
My annotated objects are very large (aspect ratio). I can’t use the predefined anchor boxes, I need to optimize them. This can be done automatically by following the steps in the anchor-optimization repository.
When I have the optimization anchors boxes values, I created a config.ini file with these values. Path: config/config.ini
Traning
retinanet-train --config config/config.ini --tensorboard-dir tensorboard/ --compute-val-loss --batch-size 1 --weights resnet50_coco_best_v2.1.0.h5 --epochs 30 --steps 3017 csv train_labels.csv classes.csv
Results
First of all, after evaluating the model I have to convert to inference model:
retinanet-convert-model snapshots/resnet50_csv_30.h5 snapshots/resnet50_MODEL.h5 --config config/config.ini
Using retinanet-evaluate with the test data (test_labels.csv). I obtain this results:
IoU=0.5
retinanet-evaluate --iou-threshold 0.5 --score-threshold 0.8 --save-path results/ csv test_labels.csv classes.csv snapshots/resnet50_MODEL.h5
267 instances of class staff with average precision: 0.9915
264 instances of class lyrics with average precision: 0.8005
29 instances of class empty_staff with average precision: 0.8276
mAP using the weighted average of precisions among classes: 0.8930
mAP: 0.8732
IoU=0.7
retinanet-evaluate --iou-threshold 0.7 --score-threshold 0.8 --save-path results/ csv test_labels.csv classes.csv snapshots/resnet50_MODEL.h5
267 instances of class staff with average precision: 0.9090
264 instances of class lyrics with average precision: 0.5846
29 instances of class empty_staff with average precision: 0.8276
mAP using the weighted average of precisions among classes: 0.7519
mAP: 0.7737
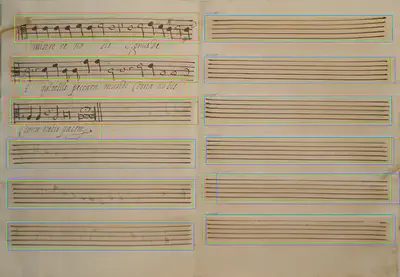
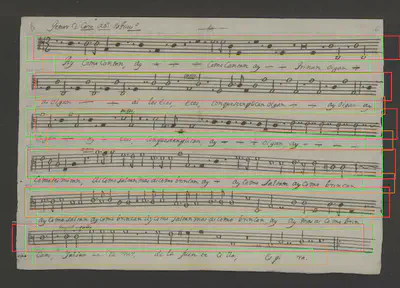
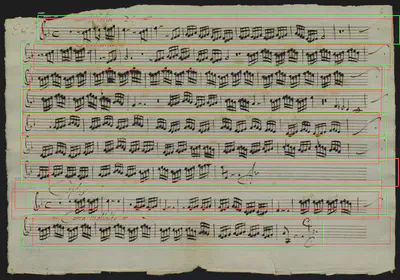
Output images
Green= GT ; Red = staff ; orange = lyrics ; blue = empty_staff


